Subscribers Only
Japan – inflation risks still rising
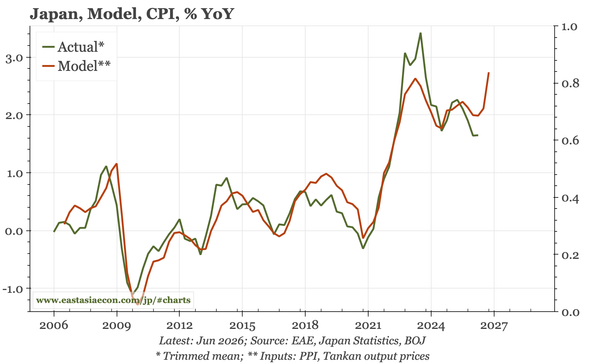
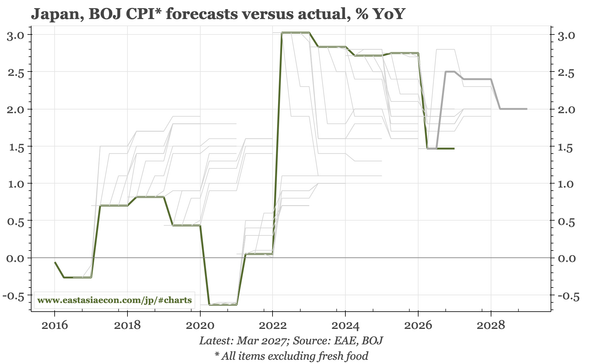
The BOJ didn't change inflation forecasts, but even so, it continues to expect inflation at or above 2% throughout the forecast period, and says risks for prices remain skewed to the upside with "medium- to long-term inflation expectations continuing to rise". September for me is a live meeting.