The China Diviner
Data inconsistencies are commonplace in economic analysis, and not just in China. Even so, that it is possible to claim that in the same month Chinese retail sales grew by 1%, 5% or 60% is problematic. We remain sceptical that the economy has recovered as much as official data suggest.

Is growth 1%, or 5%, or 60%?
Today, we've got a puzzle to present. Did retail sales in September 2022 rise at an annual rate of more than 60%, or by 5%, or closer to 1%? Depending on which cut of the data you use, all seem to be true. And this fact has big implications for how we should be thinking about the strength of retail sales – and thus the overall economy – today.
The usual measure of growth – YoY change
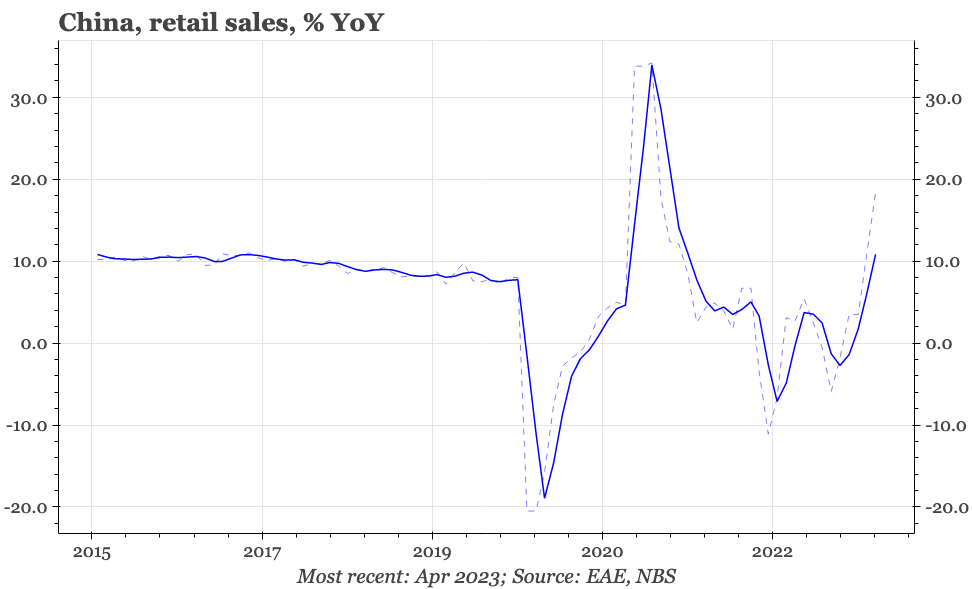
According to the National Bureau of Statistics (NBS), headline YoY growth in retail sales in September last year was 2.5%. It is this headline YoY measure – for retail sales and all other macro indicators in China– that is usually used to summarise the state of activity. That is true whether the observers are officials, analysts, or the media.
That was a reasonable approach when growth was stable. But it isn't so helpful when covid scares and restrictions in the last few years produced sudden stops in activity. That means there are now big swings in the YoY data just because of base effects, changes which thus say little about the actual state of the economy for the period when the data is released.
While less closely-followed, the government does also produce seasonally adjusted MoM measures, for retail sales, industrial production, and fixed asset investment. Given the distorting base effects in the YoY numbers, these MoM series should in theory be much more useful right now.
In theory, a better measure – MoM
According to the MoM series, retail sales grew at an annualised 5% rate in September 2022, so double the rate of growth suggested by the headline YoY measure. At least, that was what the data said when it was first released in October 2022. But that is not where the story ends.
These MoM data have a few characteristics which are worth noting. One is that they just include the totals and not any of the sectoral breakdown for retail sales, IP and FAI. For retail sales, that means there is no estimate for the MoM change in the catering revenue that is included as a category in the headline retail sales data. That's an unfortunate omission, because that is about the only official measure of granular activity in the services sector that we have.
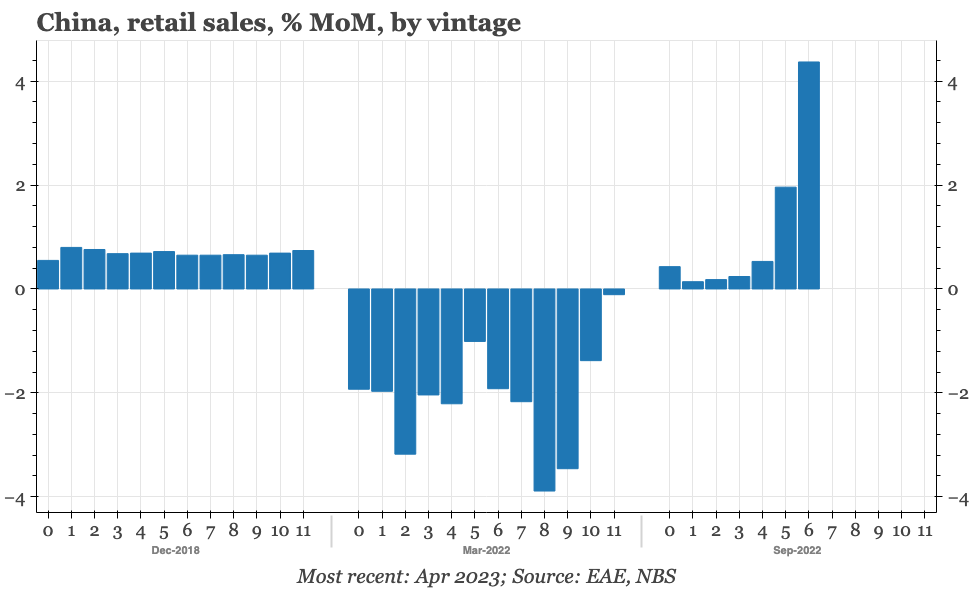
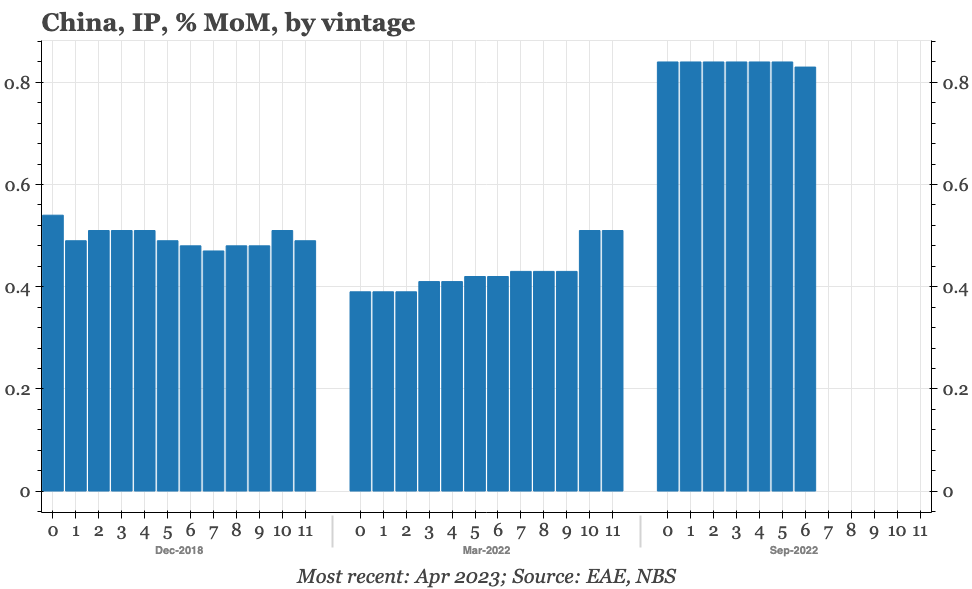
The MoM data is included in every retail sales release, each time covering the last 13 months. Unlike the YoY data, the MoM numbers are subject to revision, an aspect of the data that leads to the third solution to our puzzle. That's because before covid, the changes made from month to month were modest. But since, they have at times been massive.
So, after the first estimate 0.4% estimate of MoM growth made in October, the next month that same number was revised down to just 0.1%. It has been through a few iterations since, and according to the series published with this week's activity release, sequential growth in retail sales in September last year has now been revised up to almost 5% MoM, which is equivalent to an impressive annualised rate of more than 60%. As an example, revisions to the March 2022 data are similarly enormous, from a low of -3.9% MoM, to the last published number of just -0.1%.
Two (or three) different pictures
The National Bureau of Statistics does have a big database of macro indicators, which remains (fingers-crossed) easily accessible. But that database doesn't include MoM rates of growth, and as far as we can tell, long-term authoritative time series aren't published anywhere else. So, it seems only the last 13M are revised at any one time.
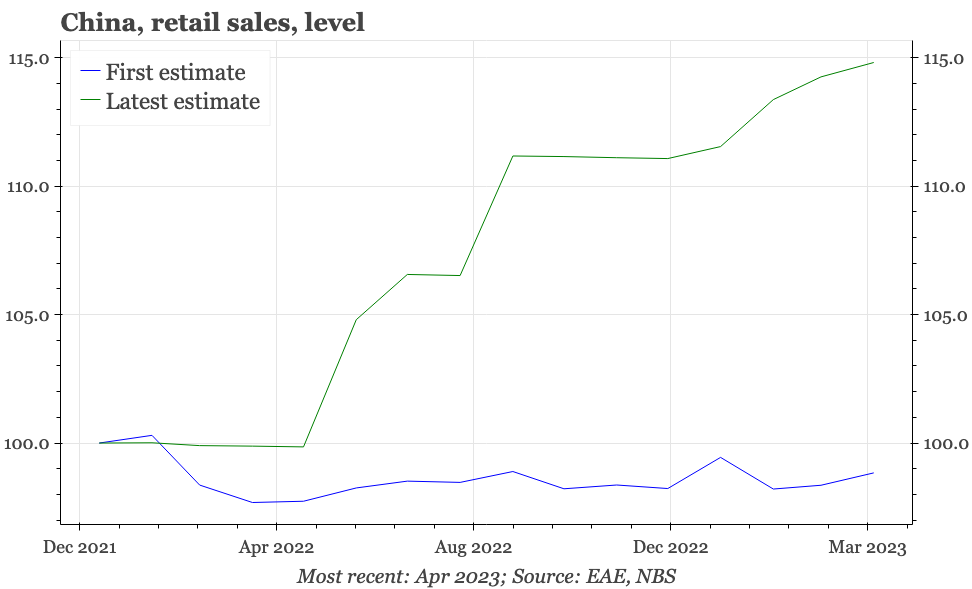
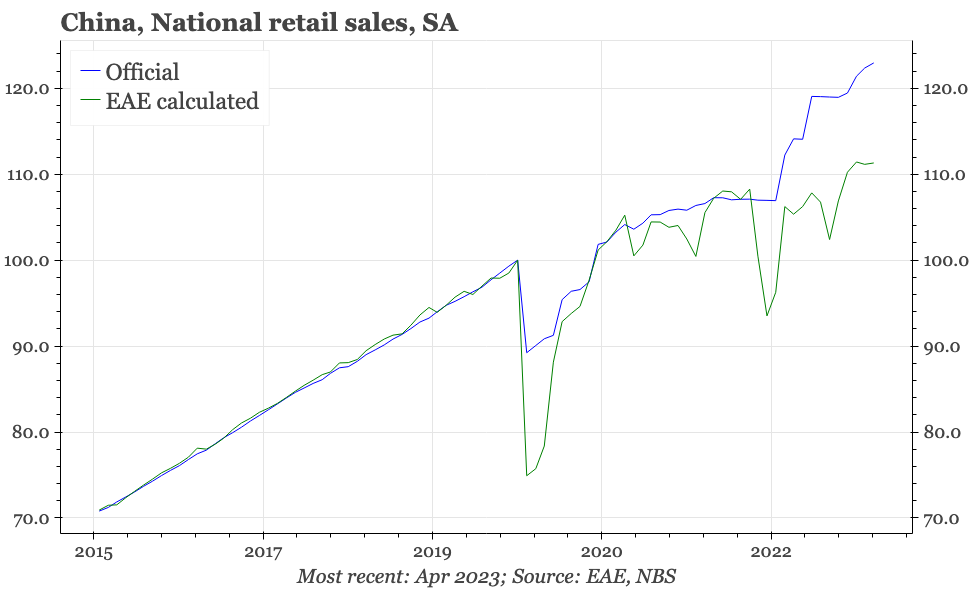
As would be expected when revisions can take data in any one month from basically 0% annualised growth to over 60%, the cumulative effect of the changes is big. If we form a time series using the first release of the estimate for each individual month, retail sales haven't grown between 2022 and now. Using the latest estimate for each month, they are up 15%.
The disparity can be shown further by backing out a YoY rate of change from the MoM series, and comparing the result with the official YoY data. To be clear, some disparity is normal, because the seasonal adjustment will alter the numbers used in the YoY calculation. As a result, that the match between the two series before covid is only rough is nothing to be concerned about. But the enormous gap that has now developed is something else entirely.
A further complication
We haven't been able to find much information that allows us to understand this breakdown. The statistical bureau says it uses standard international seasonal adjustment techniques, adjusted for the particular holidays and other idiosyncrasies of economic activity in China. The only preface to the MoM data in each month's release is a version of the sentence used to describe this week's retail sales numbers:
According to the auto-revision function of the seasonal adjustment model, the growth rate of the total retail sales of consumer goods since April 2022 was revised.
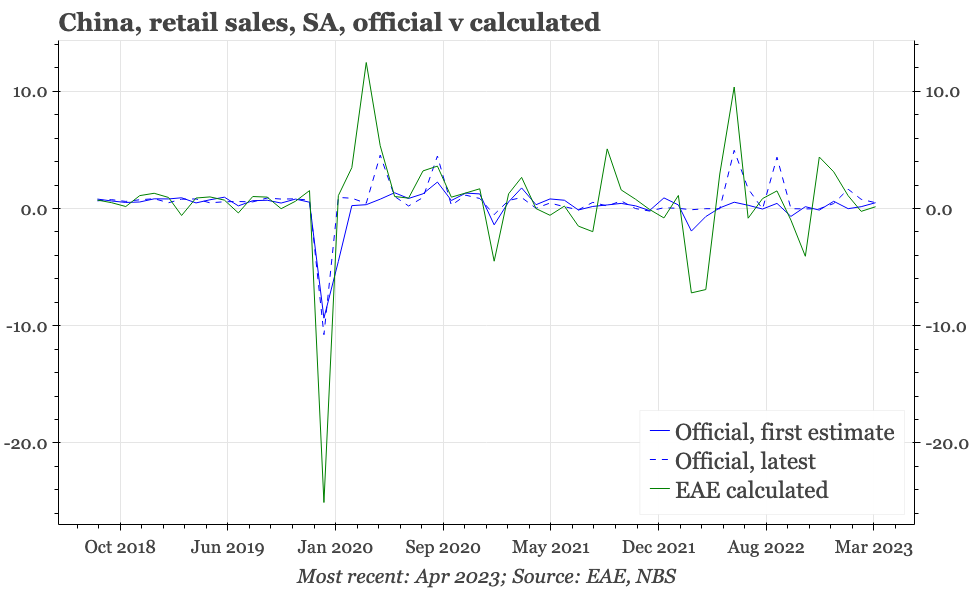
The MoM table is buried at the bottom of each release. Rather than this, the NBS's focus each time, along with the much-quoted YoY rates of change, is the CNY value of retail sales. This then gives us an alternative approach to working out the MoM data: we can do our own seasonal adjustment of these underlying CNY values (which also has the theoretical benefit of getting a measure of sequential change in activity in the catering activity that is not given by the official MoM measure). We'd assume that our own efforts would lack some of the sophistication the NBS would be able to employ, but it should give an estimate that is good enough.
But apparently, it doesn't. The government version is much smoother than the series calculated from the raw value numbers. If we assume that the government's seasonal adjustment technique if more refined than ours, then that difference is believable before covid. But even using the first estimates of the official MoM data each month, the gap between the two measures has now become much bigger, and too large to be explained away just by differences in seasonal adjustment techniques.
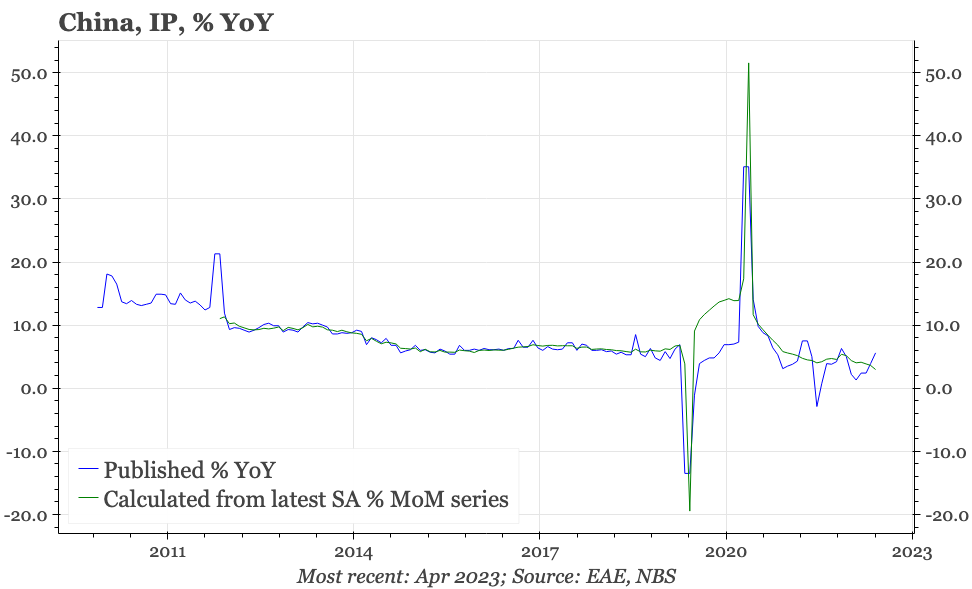
Industrial production
We have focused here on retail sales. For IP, there are also gaps between the MoM and YoY series, but they aren't so dramatic. Moreover, the post-covid revisions aren't so changeable from month-to-month. The data are far from perfect, but overall, they feel more solid (We haven't looked at FAI yet, mainly because we've long been sceptical about the quality of those numbers).
Implications
Getting back to retail sales, and the official YoY number is currently showing accelerating double-digit growth. By contrast, the MoM series suggests retail sales growth peaked in February and has been slowing ever since. However, the 15% cumulative growth in the revised MoM series since the beginning of 2022 is still big enough to get actual retail sales back to the pre-covid trend level. That is obviously important, suggesting the recent slowdown in growth might not be so worrying.
However, at least as we see things today, there isn't a strong statistical foundation for the recovery in consumption that has been widely identified. Maybe that is inevitable given the unprecedented shocks to the economy delivered both by covid, and the subsequent zero covid regime. And it is also worth noting that we haven't been able to find any other discussion of the MoM numbers, and so it is possible our interpretation presented here is off-base. If any readers have insights, please let us know.
In the meantime, we find it very difficult to get conviction from the official data about the strength of consumer spending. That leaves us continuing to give a high weighting to other measures such as consumer confidence, and for the most part, they remain weak.
