
China – consumption guide
China's economic data are widely cited – but aren't well understood. To try to tackle that, I have been making some data guides. This first one tackles consumption.

NBS retail sales release — click to enlarge
Goods
The year-on-year percentage change in retail sales published by the National Bureau of Statistics is the number most commonly cited when discussing consumption. But is it accurate?
The data come from the monthly release on retail sales. As would be expected, that includes the underlying value of retail sales in CNY terms. But if we calculate the YoY change from those value terms, it differs from the published YoY growth rate.
The NBS says that the published YoY growth rate is the right one because
“the year-on-year growth rates of the retail sales of consumer goods and other indicators for enterprises above the designated size are calculated based on the same statistical coverage of enterprises as in the current period, which is different from the coverage of data published last year”
Not ideal, but still, we can use the YoY growth rates to calculate a compatible back series for CNY values. Why do this? When retail sales before 2020 were growing at 8%, quoting YoY growth rates was defensible. But since the pandemic, retail sales have become more volatile. Now, if YoY growth is strong in say May, it might be telling us more about how terrible growth was last year than what is happening now. So we need to understand what is happening in month-on-month terms too.
Knowing the level of retail sales – the back series in CNY values that we’ve calculated – is the first stage in calculating MoM growth. The second is to seasonally adjust that data. The reason is retail sales have strong seasonal patterns: growth might pick up in October, for example, as people buy more winter clothes, but that doesn’t reflect a true increase in consumer demand. We need to adjust for that.
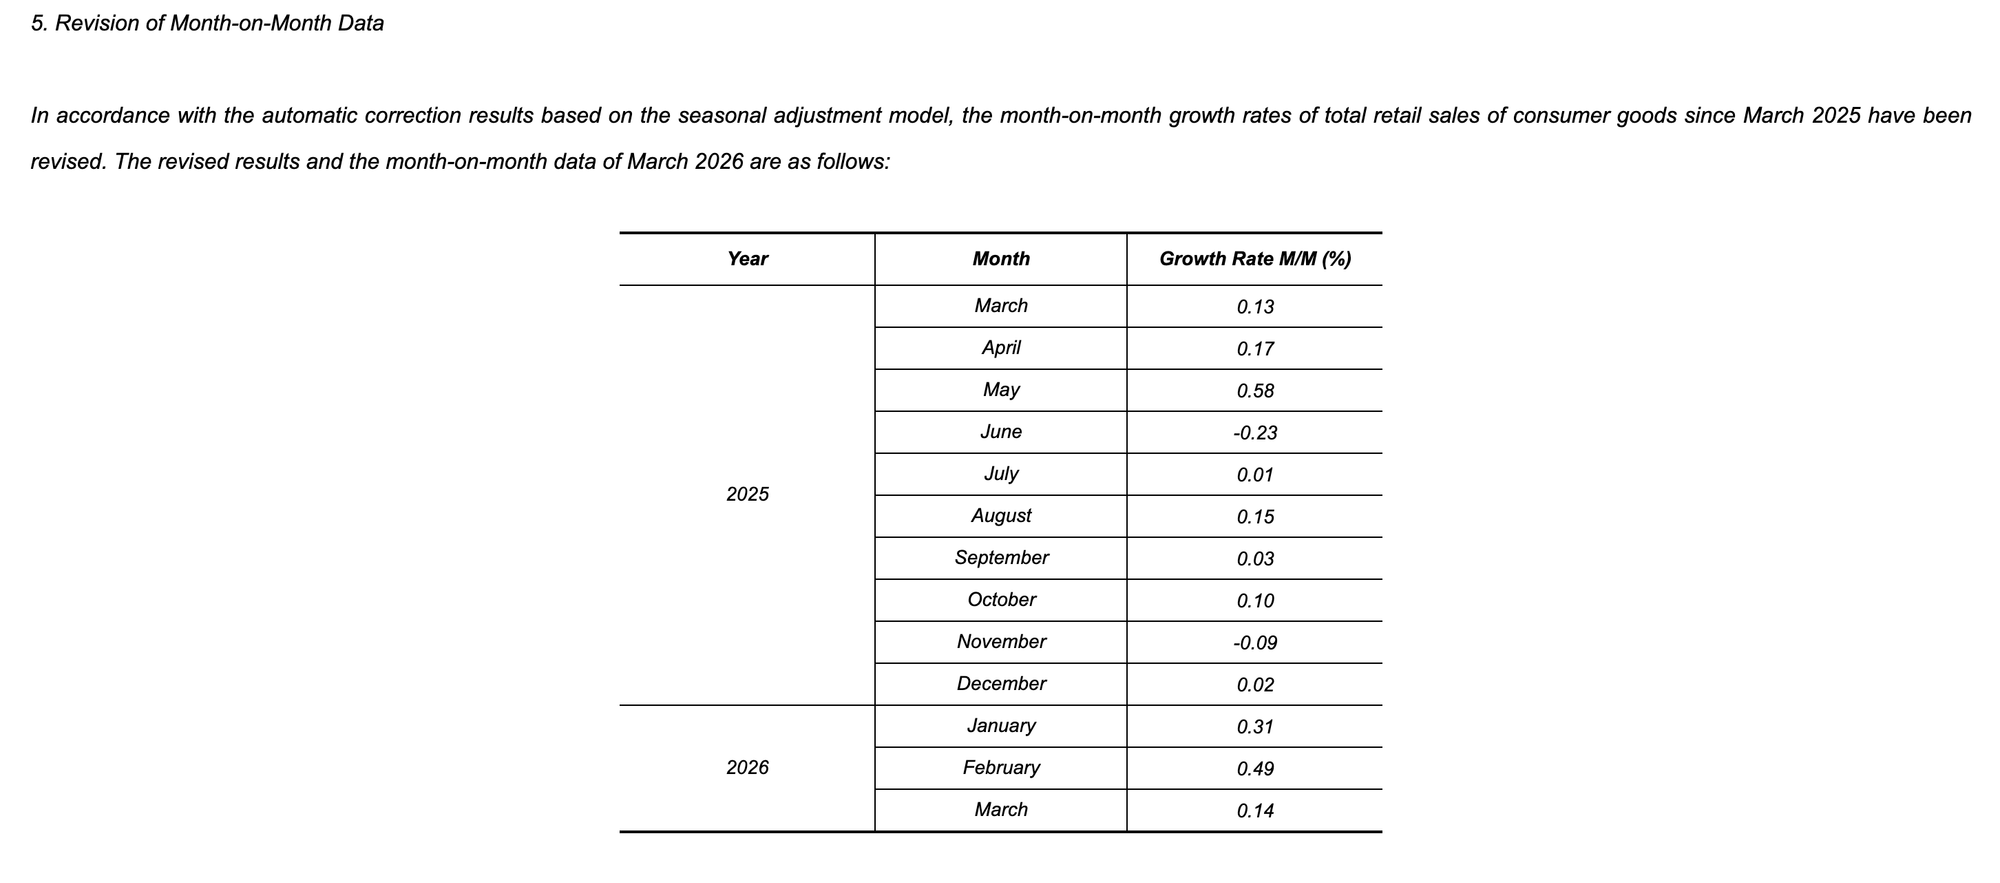
Most governments provide important economic data in seasonally adjusted terms. At a headline level, the NBS doesn’t. However, in every retail sales release, it does provide data for the last 13 or so months for the seasonally adjusted MoM growth.
From that, we can calculate a back series for retail sales in level terms. Unfortunately, this back series doesn’t come close to matching the back series we create using the headline YoY data.
There is one more feature of the MoM series that is important: it can be revised in a way that the YoY data aren’t. During the pandemic, the revisions were huge. Indeed, the MoM give the sense that for a time, the government didn’t really know what was happening to retail sales – a big contrast with the certainty with which the YoY data are usually reported.
Since 2024, the scale of revisions has lessened. Still, every month there can still be differences between the calculated and reported MoM rates of growth. I’d like to believe that the NBS has a more sophisticated seasonal adjustment methodology than the off-the-shelf version I use. But still, it is difficult to know which is the right number.
Services
So far, we’ve introduced three concepts for looking at data: YoY and MoM changes, and underlying levels. It is useful to keep those concepts in mind as we broaden the analysis to include services. This is necessary because retail sales is essentially a measure of goods consumption. And yet data from the NBS’s household survey reports that almost 50% of overall consumer spending is now on goods.
An increase in spending on services is what usually happens as economies develop. In China, in addition to the NBS’s household survey, the PBC’s quarterly survey of urban depositors also shows spending preferences shifting away from goods. Unfortunately this useful survey from the PBC is published increasingly erratically. The most recent version is now for Q425.
In recent years the NBS had started to give a new measure of retail spending on services. However, it has been difficult to do much with that when it is reported only as the % YoY change, and worse still, in year-to-date rather than monthly terms.
The better measure is the household survey itself, though it is only published quarterly, and in year-to-date terms. It is also a per capita measure, while retail spending is aggregate. We can, however, adjust for all those. Doing that, the result is still that consumption is slowing, but not as seriously as in the headline data.
Total consumption
Because it includes services, this household survey data should be a more accurate measure of consumption than retail sales. We can check that by comparing against the GDP measure of private consumption. That is what most economists elsewhere would use as the most comprehensive measure of consumer spending.
In other economies, private consumption is published quarterly whilst in China only annual data are available. Growth in neither retail sales nor consumption in the household survey are exact measures of private consumption, but in recent years, the household survey has indeed been the more accurate measure.
Prices
Elsewhere, we would ordinarily be making one more adjustment before looking at overall consumption. That’s because all the measures we’ve used so far are nominal measures, including inflation. When prices are rising, consumer spending often will too, but that is just because things are becoming more expensive, not because consumers are actually choosing to spend more.
As with seasonal adjustment, in other big economies, the calculations of consumer spending in volume terms are done by the government. In China, that doesn’t happen. The only measure of volume growth that is available is a quarterly measure of the contribution to growth in constant price GDP by overall consumption – meaning government and private consumption combined.
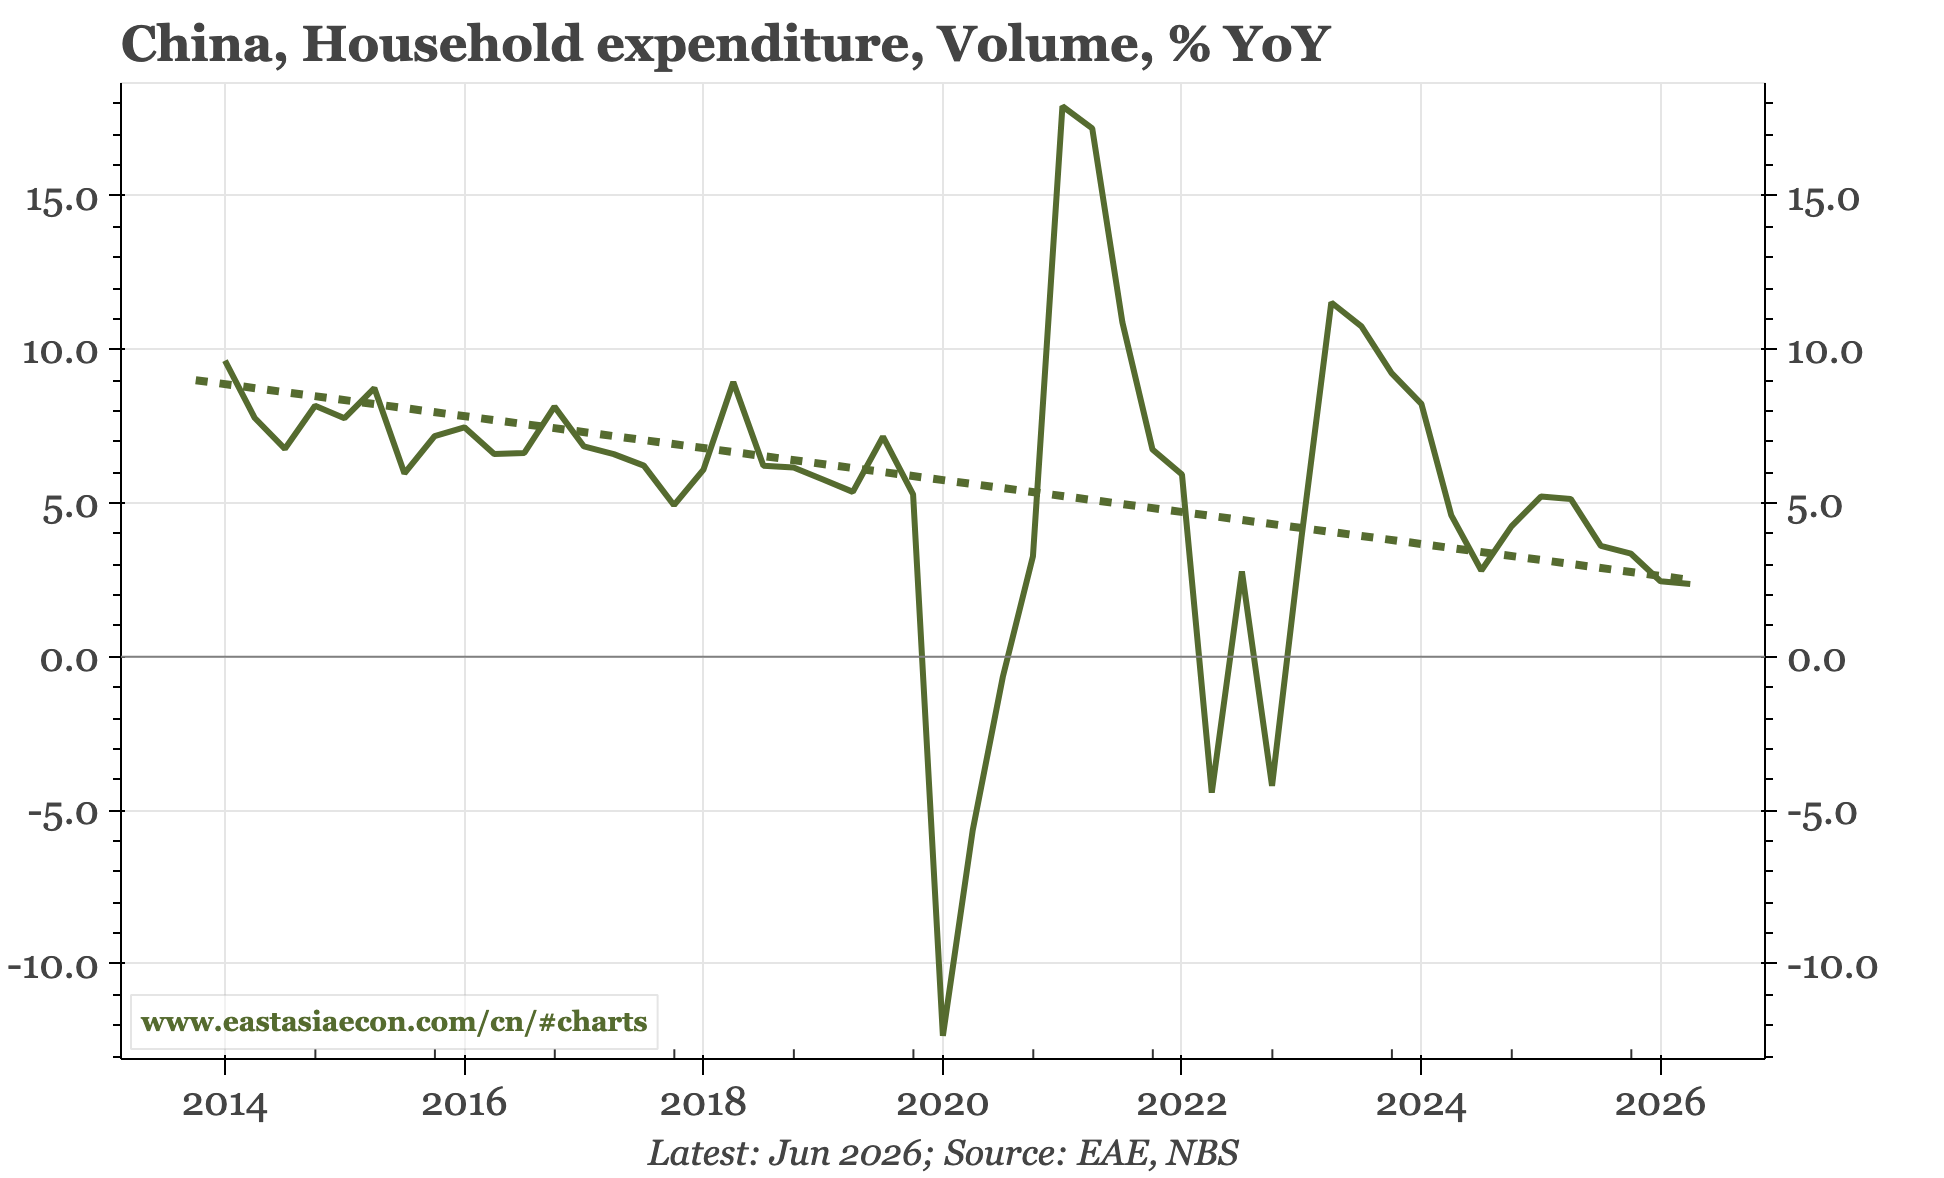
That isn’t particularly useful. However, as we have price data, we can deflate the nominal measures of consumption that we do have, using goods prices in the CPI for retail sales, and the overall index for measures of consumption that include services. With inflation so low, this doesn’t change the picture much: we still end up with goods consumption growing hardly at all, and overall consumption rising at low single-digit rates.
The price adjustment was more important before 2020, but while that seems like a long time ago, it does have some relevance for thinking about consumption today. That’s because overall household spending in real terms was clearly slowing even before the pandemic hit. In this sense, the weakness of consumption now isn’t new, but is part of a trend that has been in place for almost a decade already.
Per capita
There is one more point that is worth remembering about consumption: the ageing of the population. Even if consumption per capita starts to grow more quickly, aggregate consumption might still be weak simply because there are less people to spend money. This is a phenomenon that is already being seen in Japan., and will become more evident in China in the years to come.