Region – understanding the data issues
I've spent a lot of time in recent years building an infrastructure to analyse the economies of East Asia. Doing so has given me a good understanding of the data challenges in the region. In this video, I discuss those, and introduce the platform I've built to present all the data I've collected.

As you may know, I’ve spent a lot of time the last three years building a python-based platform to collect, process and present all the data you need to understand the big economies of East Asia.
Doing that has given me a good understanding of the challenges involved in all those three stages. In this video, I discuss just what they are, and introduce the data platform I've built.
The focus is China, where the data do have deficiencies, but the biggest problems aren’t the ones usually discussed. As an example, if I had to rank the economies in terms of accessibility of data, Taiwan would be first (both the government and central bank provide very good APIs), but China isn’t any more difficult than Korea.
My biggest frustrations with China's data isn't that availability is deteriorating, but that it isn't improving. China's government clearly has huge capabilities, and yet details of the CPI basket, to give one example, aren't made available.
With problems like that, it does take a lot of work to clean up and make sense of China's data. Given that, I think there is some value in making the processed data available.
I do that in two ways. First, via hundreds of interactive charts on the home page for each economy. The charts and underlying data are all downloadable. For subscribers, the China charts can be viewed here:
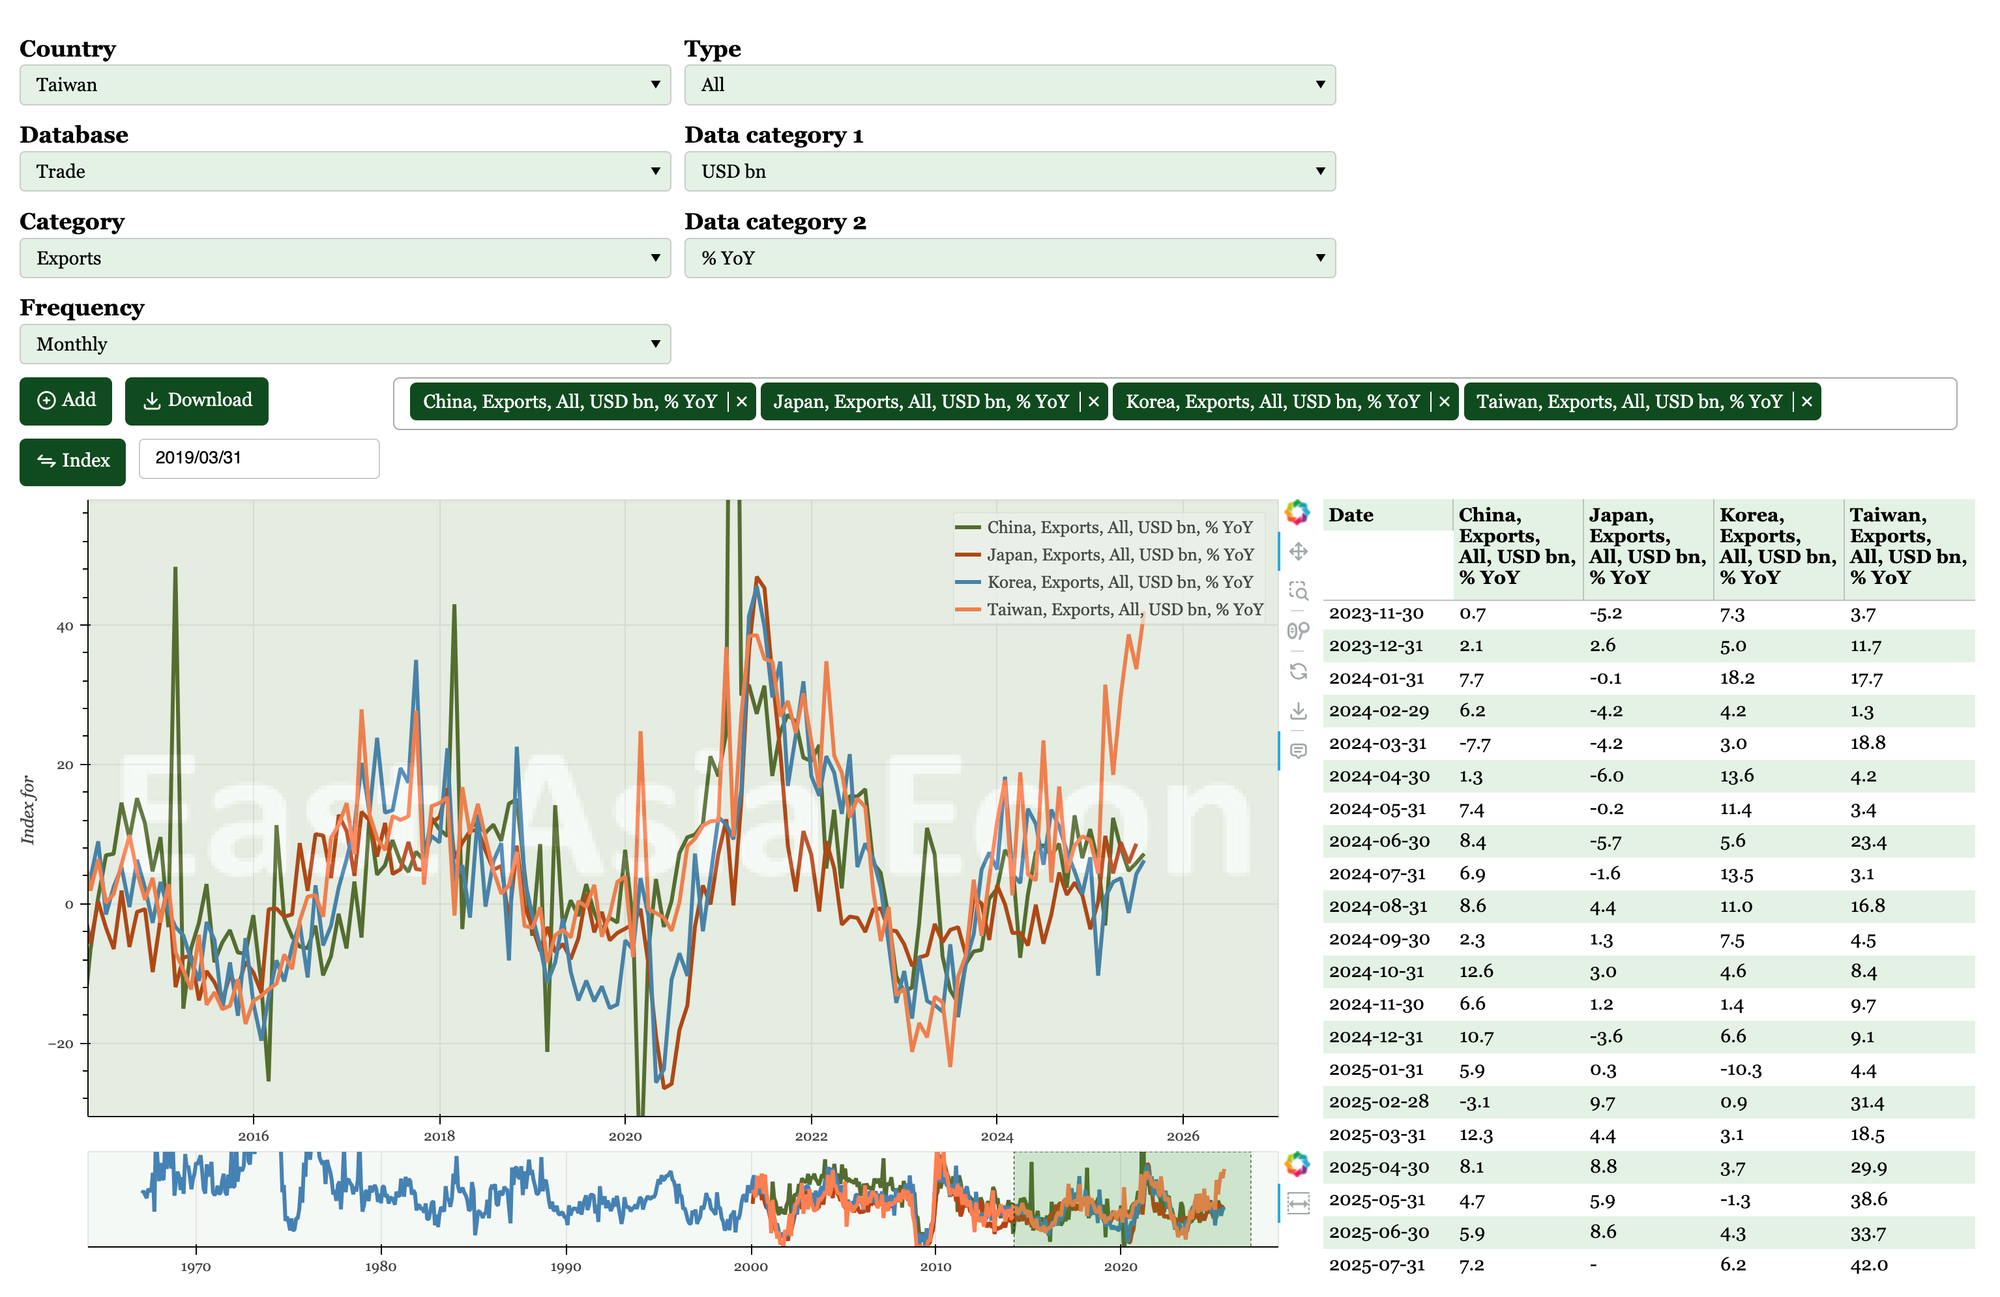
Second, an app where you select what data to chart. For the moment, that isn't behind a paywall: